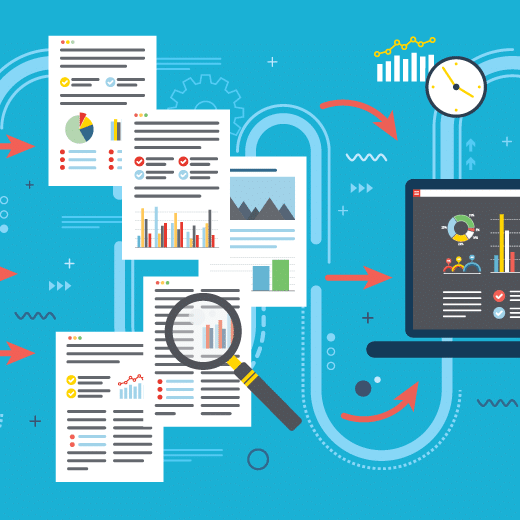
Getting Started with a Data and Insights Strategy

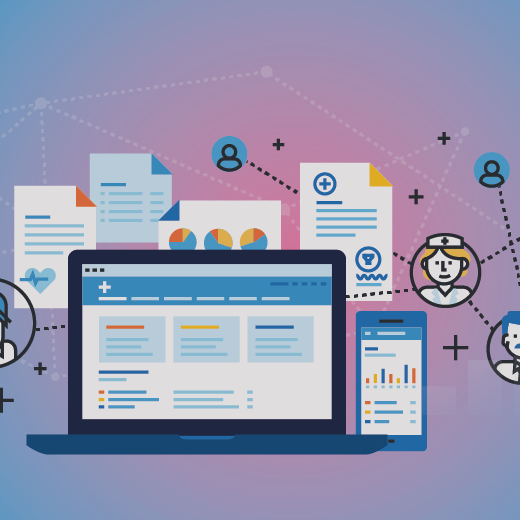
In the digital age, we as customers are always creating data and information everywhere we go. Every time we visit our favourite restaurant and leave a review online, or subscribe to our favourite Digital Marketing Blog newsletter, our digital footprint is recorded. As marketers, no matter what industry you are in, the most valuable asset that you have is the data you capture from your customers. This allows for businesses to make data informed decisions that nurture the relationship with current clients, and to breach the gap between marketing efforts and prospects.
At Goose Digital, we support digital marketing strategies across a wide range of businesses and industries. We’ve learned that small and big businesses alike struggle with setting the foundations of a reliable and effective data and reporting strategy that informs each and all sections of your marketing funnel and provide insights across the organization. For that reason we’ve outlined 3 main steps that will help you get started on the right path.
1. Develop strong KPIs and track your metrics
Let’s start at the beginning. You’re probably already storing a healthy amount of data from your clients and their behaviour. Now you want to know how to act on it.
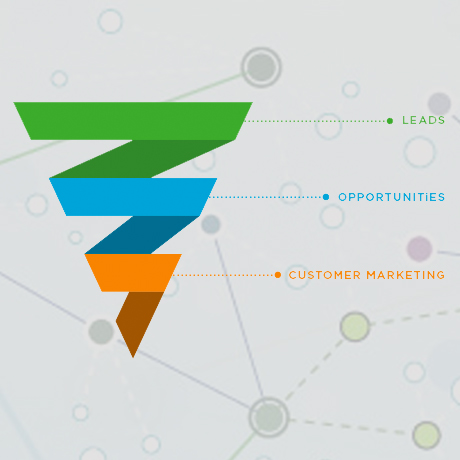
In order to understand how successful your marketing efforts are you need to identify the conversion points and how to reliably measure these KPIs. In this stage we want to ask questions such as:
- Am I gathering all the data that I need already? If not, what am I missing and how do I start collecting this information?
- If I know that I have the data, do I know where it’s being stored? Is it easy to access? Do I need some other person/department/tool assistance to retrieve it?
- Will I need to store historical data for future comparisons?…
Once you have a thorough understanding of your customer’s journey and the main metrics you need to measure success you’ll be able to build the framework of your reporting.
2. Clean and fix your data
I will not lie, this may not be the most exhilarating step of this process but it is oh so important! The data you’ve collected will be your source of truth. Therefore, you want it to be as accurate and clean as possible, before you dive fully into it. Before anyone can start making sense of their data, it needs to be validated, reviewed for errors or inconsistencies, and corrected. These fixes can range from spelling mistakes to erroneous date and price formatting to missing rows of data. Tools such as Microsoft Excel, Google Sheets or Pages will become your best friends when it comes to sorting, filtering and fixing datasets. For larger data sets, data assessment tools may be more efficient for correcting bad data.
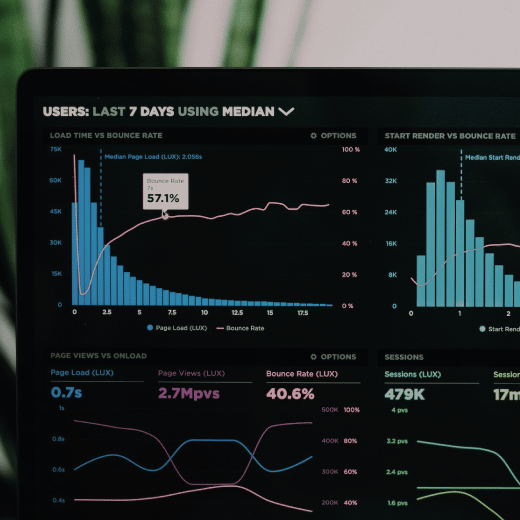
3. Let the data tell the story
Now that your dataset(s) is in tip top shape you are ready to make sense of the information you’ve gathered. Here’s where all the magic happens; with your help all those performance KPIs and metrics will tell the story (hopefully a positive one) around the efforts and results your department has invested in. The challenge, now, is to present a cohesive and insightful report that will not only show key behavioural trends and shade light on what worked and what didn’t, but more importantly explain the why. A pretty PowerPoint with shiny charts will only get you so far. The real value is in understanding the metric’s relevance and presenting them in a concise manner, with actionable insights that will guide future decisions. Data driven insights should empower your business to strategically invest time and effort based on what you know works and where you can realize the greatest impact.
No matter where you are in your data and insights journey – from identifying KPIs, to assessing and cleansing your data to building the right reporting framework – we can help. Contact us for more information.


![[Blog] Insurance Brokers: Focusing on Growth Today and Tomorrow](https://goosedigital.com/wp-content/uploads/2022/05/Featured-Ins-Brokers-Future.png)


![[Blog] How Marketing Automation and Data Can Be Your Insurance Brokerage’s Key Difference-Makers](https://goosedigital.com/wp-content/uploads/2022/03/Featured-MktgAuto-Data-Ins.png)