I’m here to tell you that your email marketing metrics (or KPIs) are wrong. Your email opens and clicks are probably inflated by 50% or more. In fact, we’re finding that email marketing key performance indicators (KPIs) are becoming increasingly more unreliable as time goes on, rather than less. However, not all is doom and gloom; there are solutions to help alleviate this issue with email reporting, giving you a better sense of the truth. But be ready for a wake-up call on how well your emails are actually doing.
At Goose Digital, we already utilize temporary solutions like IP filters and manual data review. Our reporting methodology is going to be shifting away from raw email metrics, towards reporting on audience engagement trends.
Wait, What? My Emails Aren’t Doing So Hot?
If I sent a one-off email…I wouldn’t even care what the open or click rate was.
Since emails are so integral to the campaigns that we run, it’s extremely important that we are able to report accurate numbers. The usual suspects are delivered %, open rates, click rates, etcetera. Metrics like delivered, hard bounces, soft bounces or spam complaints are generally hard, accurate numbers. What we’re seeing is that positive user actions are becoming more inaccurate to report on as time goes on; opens and clicks – the two most important metrics, are also your most unreliable.
It’s not just email reputation.
We’ve spoken before about email reputation; the better your sending reputation, the more likely you will land in the inbox rather than spam.
Let’s say you have a great email reputation, but you’re still not seeing much engagement from your email lists, despite great open rates and click-through rates (CTR). A good chunk of your opens and clicks are probably fake. Here’s why.
Open Rates = Almost Useless
We can expect industry-wide open rates to gradually decrease over time.
An open is triggered when a user downloads a tiny tracking pixel image in the email. Since this open action is based on downloading images, the data can become heavily skewed positively or negatively:
- Email Clients: Microsoft Outlook and many other email clients disable images by default, so these users will not show up as opening your email at all. Even if these users open the email in their preview pane, you would have no idea they opened the email. As more businesses update their Outlook clients, you will likely see a downward trend in B2B open rates.
- Spam Filters: Some email clients will automatically flag an email for spam if it has too many images (including your tracking pixel); this auto-spam functionality is more prevalent in web clients such as Gmail, which are adopting technologies like machine learning to reduce inbox spam. Getting into inboxes will get harder over time, not easier if your email strategy doesn’t change.
- Anti-Malware / Email Protection Services: ISP or user-installed anti-malware software, such as Barracuda, will often open emails before the user even sees them, triggering a false open if the software also downloads the images automatically.
Comparing open rates can be useful for A/B testing (subject lines, time of send, etcetera) because you can be assured that at least a percentage of your opens will be real people. But A/B testing is about where the usefulness of measuring your open rate will end.
A real world example.
For example, a client of ours sent out an email last year to a fairly cold list. We saw a remarkable 25% open rate on that email, considering most of the list had never heard of the client, but as we dug into the numbers, we encountered this:
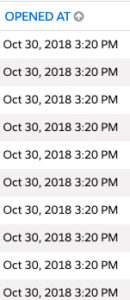
Can you guess what time the email was sent? Yup, 3:20 PM. It’s important to note too, that we cropped this image – the number of people opening the cold email within 1 minute of the send was in the hundreds, almost 40% our total unique opens.
After we pulled the list of opens, we then cross-referenced these same emails with the clicks on our “hidden bot link” (more on that later) and found that they were almost identical. We came to the conclusion that the majority of people opening within 1-5 minutes of our email send were not opening the email at all – their email protection software was.
Whether these people viewed the email themselves later was largely irrelevant – the damage was already done to the unique open rate. And let’s use some social logic here too; how many times have you opened an email right away from a company you probably have never heard of, during the middle of a workday? Probably not that often.
The main takeaway for opens is not to rely on them at all, apart from A/B testing within a short time frame. We can expect industry-wide open rates to gradually decrease over time.
Clicks Are Dead Too
In some of the older articles I linked above, they speak to how CTR is still a reliable metric. However, in 2019, clicks are becoming just as unreliable as opens. Lever10 tracked their number of clicks over time using a specific, hidden link inside all of their emails. The results are shocking.
…if the MAP reported 240 unique clicks, we filtered that down to 4 real human clicks.
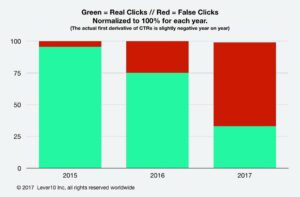
Source: Lever10, 2017. Retrieved February 26, 2019.
As you can see, the number of bots clicking links increased exponentially year-over-year. And that was two years ago. Despite efforts from Marketing Automation Platform (MAP) vendors to filter or limit the number of bot clicks in an email, we’re still seeing a high volume of false clicks in our email sends.
We ran an experiment for ourselves.
Using the same client I showed for open rates, we included a hidden link in their emails and tracked the clicks on that link. There was no way a human would be able to see this link – it was hidden in the email’s CSS code so even in the text-only version of the email, the link wouldn’t be visible, as no CSS would appear.
In keeping with the exponential growth trend Level10 showed for bot clicks, our late-2018 emails had a predictably worse organic CTR than 2017. The number of bot clicks for some of the emails we sent surpassed 96% of our number of unique clicks. So, if the MAP reported 240 unique clicks, we filtered that down to 4 real human clicks.
Generally, we found that people who click the first link (usually “View in Browser” by default) in an email within 1-5 minutes of the send are actually bots.
Filtering Out the Problem
A common solution for the staggering number of fake opens and clicks is to implement IP filters. These filters will eliminate bots / ISPs / anti-malware software from your reports. While those bots are still opening and clicking your emails, you just won’t see them reflected in the MAPs email metrics.
For example, we send out a newsletter about once a month (and you should totally subscribe). When we put in place a certain number of IP ranges (mostly filtering out the usual suspects of Barracuda and Microsoft Outlook 365 bots), our click rates were cut in half.
However, this is only a temporary stopgap. Email protection software gets more sophisticated every day; they don’t want us filtering them. Their entire purpose is to protect users and reduce the amount of spam that’s out there. The IP ranges that need to be filtered will be in constant flux, requiring the due diligence of email marketing pros to keep on top of. And that still won’t be enough to generate completely accurate numbers.
Track Engagement Trends, Not Emails
…digital marketers should be looking to the actual calls-to-action instead of the email itself.
This blog is already fairly heavy, so maybe I’ll write another post in the future to discuss more in-depth on where we think email marketing is going.
Essentially, your emails should just be a part of your digital strategy, not the strategy itself. A good outbound marketer already knows this, but it’s a common notion for newcomers to the space to latch onto email like this “be-all-end-all.” That notion is why “batch and blast” emails are still so common in 2019, despite being proven repeatedly to be highly ineffective at engaging an audience.
Instead of just looking at your MAPs email report and calling it a day, digital marketers should be looking to the actual calls-to-action instead of the email itself. How well did the form perform that this email sends people to? How many people downloaded my white paper? Does my audience even engage with my email CTAs at all?
After, track these trends! Does your manufacturing audience engage more with videos, while your insurance audience engages more with written blogs or white papers? Take note of where you begin to see patterns in user behaviour.
If I sent out a one-off email (without A/B testing) to my master list of a thousand emails, I wouldn’t even care what the open or click rate was. What was the CTA? Did that CTA engage users once they clicked through? Measuring user engagement with your content and your brand over time will give you far greater insight into what you’re doing right and what you’re doing wrong.
Stop relying on your email metrics and instead look at engagement trends. A digital marketing strategy and technology stack should hone in on behaviours, and engagement throughout the prospect/customer life-cycle.
An Expert Solution
I spoke briefly above about filtering IPs – it’s true this eliminates some bots from your email metrics. However, filters are a temporary solution and not definitive. This is where having a partner like Goose Digital will provide immense value to not only give you more accurate email results but providing insight into your digital strategy (if you have one) as a whole.
We understand the constantly changing nature of email marketing. We dig deeper into email data, rather than just what the MAP is telling you out of the box. From there, we can make expert insights and recommendations, based on how well the email campaign is actually performing.
If you’d like to learn how Goose Digital can help with your email reporting and/or digital strategy, give us a shout.